Executions
Every time CIS starts or stops an instance, it records an execution. The Executions page gives you a complete audit trail of every action taken — what happened, when, and whether it succeeded.
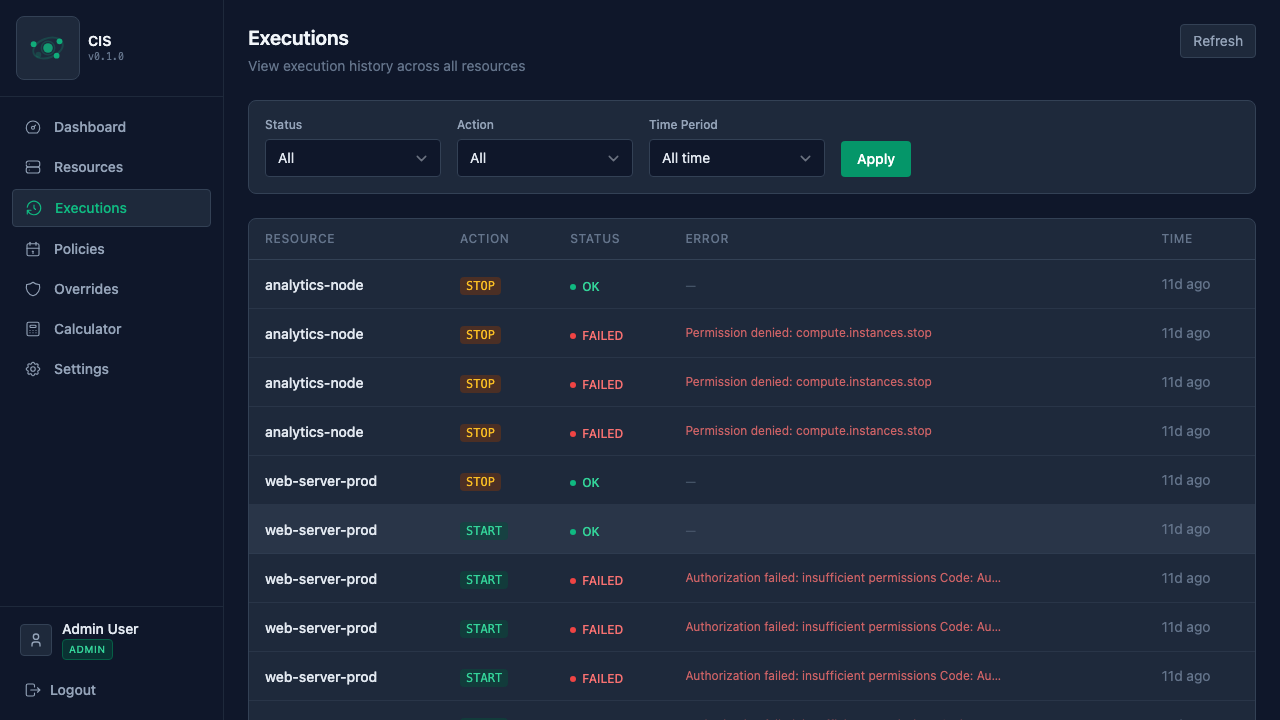
Reading the execution log
Each execution entry shows:
- Resource — which instance was acted on, with its provider badge
- Action —
STARTorSTOP - Status — success, failed, or in progress
- Timestamp — when the action was executed
- Error details — if the action failed, the error message from the cloud provider
Filtering
You can filter executions to find what you're looking for:
- Status — show only successful, failed, or in-progress executions
- Action — filter by START or STOP actions
- Time range — last hour, last 24 hours, last 7 days, or all time
Filtering is useful for troubleshooting — for example, filtering by "Failed" to see which instances had issues, or by "Last hour" to verify a recent policy change took effect.
Resource timeline
Each resource also has its own execution timeline on its detail page. Go to Resources, click on any instance, and scroll to the execution history section. This shows a chronological view of every start and stop action for that specific resource, making it easy to verify that scheduling is working as expected.
Dashboard summary
The Dashboard includes an execution summary widget showing counts for the last hour, 24 hours, and 7 days. Success and failure counts are shown side by side, so you can quickly spot if something needs attention.